【案例】雅思小作文范文之房屋的數量
來源:互聯網
小編:天空 393雅思寫作小作文圖表題之房屋的數量,詳細內容包括思路解析以及范文分享,有需要的同學千萬不要錯過了!

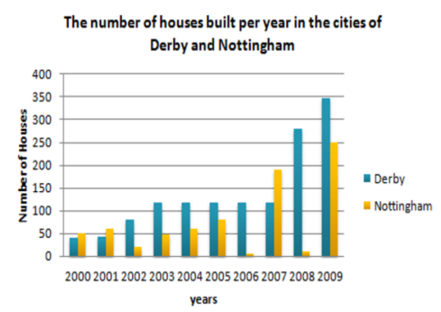
Task:The number of houses built per year in two cities between 2000 and 2009.
思路解析:
典型的動態柱狀圖,請參考折線寫法:
1. 注意極值的描述:最大值,最小值,交點等;
2. 明顯的數據特征:如保持不變,劇烈上升或下跌等,需要呈現。
參考范文:
The bar chart describes the number of houses built in two neighboring cities, Derby and Nottingham, Between 2000 and 2009.
Overall, the number of houses that were erected in Derby exceeded upwards the quantity constructed in Nottingham. The trend for the former was decidedly upwards, with Derby experiencing a steady rise from 40 new houses in the first year, to just under 120 during the 2003. Over the next 4 years of decade, new houses construction in Derby remained constant at just under 120. This is in sharp contrast to the last two years when the number of houses that went up in Derby leapt, first to 280 and then to 350 houses.
Houses building in Nottingham, by comparison, was much more erratic. In the first two years of the decade, more houses were erected in Nottingham than in Derby. In 2002, however, construction declined to only 20. Over the next three years, houses numbers rose steadily, only to drop practically to zero in 2006. There was then a dramatic surge in 2007 with over 200 houses being built. While in 2008 saw house building in Nottingham plummeting to only 10, in 2009 the number of new houses rocketed to 270, a rise of more than 2600 % on the previous year.
(212 words)
雅思小作文圖表作文記得先看清題目,開頭段不要忘記改寫,平時的時候多積累一些替換詞,更多雅思寫作考試資訊請繼續關注環球教育官網。
精彩推薦:

